Neuromorphic
Judy Fan on Cognitive Tools: How Drawings, Diagrams and Charts Make the Invisible Visible
From the coordinate plane to Feynman diagrams, humans invent tools that make the invisible visible. Judy Fan's MIT colloquium shows how people abstract when they draw, explain and read charts, and where today's AI models still see differently.
 Akmal Alif · 8 October 2026 MYT
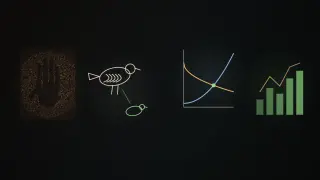
Nature did not give us the number line. We invented it, then extended it into coordinate axes, diagrams and charts, and those inventions changed what human minds can think. That is the starting point of a March 2025 colloquium by Judy Fan, a cognitive scientist at Stanford, hosted by MIT's Brain and Cognitive Sciences department and the MIT Quest for Intelligence and introduced by Josh Tenenbaum (MIT Siegel Family Quest for Intelligence, 2025).
The talk asks what it is about the human mind that makes these cognitive tools possible, and how today's AI systems compare when they try to read or make them. It runs to seventy minutes, so this post follows its main arguments. The video is embedded below, and the timestamps jump to the matching moment.
Tools for thought
Fan opens with the coordinate plane. When Descartes and contemporaries linked algebraic expressions to geometric curves, problems such as the ancient Delian riddle of doubling a cube became questions about where two curves intersect (watch from 4:12). Four centuries later, the same tool is so familiar that every mathematics curriculum teaches it, and nobody thinks of it as an invention any more (watch from 5:14).
The story is much older than Descartes. Fan traces it to people marking cave walls tens of thousands of years ago, and through the history of science: John Gould's illustrations of Darwin's finches, Galileo's telescope, Ramón y Cajal's drawings of the retina and Feynman diagrams of events no one can ever see directly (watch from 6:15; 7:17). Some of those images are faithful and some are schematic. What they share is what Fan calls visual abstraction: presenting what we see and know in a form that highlights what is relevant to notice (watch from 8:18).
Fan's framework adds two things to the usual picture of cognition. The first is cognitive tools, material objects designed to change how and what we think. The second is engineering, the use of what we understand to build new things (watch from 10:20). The lab's aim, put bluntly, is to explain both halves of that loop (watch from 11:21).
Why a few lines can mean a bird
The first half of the talk uses freehand drawing as its case study, building from perception to drawing to communication (watch from 12:21). There are two classic answers to why a sketch can stand for a bird. One is resemblance: the drawing looks like a bird. The other is convention: we learn from other people which marks go with which things, as with written characters (watch from 14:23).
Earlier work by Fan and colleagues found that vision networks trained only on photographs generalise surprisingly well to sparse sketches, which supports a modern version of the resemblance account (watch from 15:23). But a fixed visual process cannot explain the blobs, boxes and arrows on a whiteboard, whose meaning depends on what people are talking about (watch from 17:23).
So the lab studied context directly. In a two-player drawing game, a sketcher drew one object from a set of four. When the other objects were from the same category, sketchers drew in more detail; when they were from different categories, they drew sparser sketches with fewer strokes and less ink, and viewers still picked the right object (watch from 18:24). A model that combined a neural network's visual features with a probabilistic module that reasons about the viewer captured that behaviour, and both parts were needed (Fan et al., 2020; watch from 19:26). With repeated interactions, pairs even developed their own shorthand, increasingly abstract marks whose meaning depended on their shared history (watch from 20:27).
Explaining is not depicting
People also draw to explain how things work. Work led by Holly Huey asked what people put into a visual explanation compared with an ordinary depiction (watch from 21:28). If explanations were simply depictions with extra information, they should keep everything a depiction has and add mechanism. If they are a different kind of image, they should trade appearance for mechanism (watch from 22:29).
Participants watched novel machines in which some parts turned a light on and similar-looking parts did not, then drew some machines to explain them and others to depict them (watch from 23:29). Explanations gave more strokes to the causal parts and to arrows and motion lines; depictions gave more to the background (watch from 25:31). And the trade-off was functional. Explanations made it easier to tell how to operate a machine, while depictions made it easier to tell which machine it was (Huey et al., 2023; watch from 26:32). People share intuitions about what an explanation should contain even the first time they make one, and those intuitions sacrifice visual fidelity for mechanism (watch from 28:33).
Where machines still differ
If we understood human visual abstraction, Fan argues, we should be able to build systems that understand and produce abstract images the way people do. Picasso's famous series of bulls, from detailed to a few lines, is the test any such model should pass (watch from 29:33).
To make that measurable, the lab built SEVA, a benchmark of about 90,000 sketches of 128 concepts drawn by roughly 5,500 people under shrinking time limits, down to four seconds (Mukherjee et al., 2023; watch from 31:35). People and 17 vision models then labelled every sketch. More detailed sketches were easier for everyone, but the differences between models were dwarfed by the gap between models and people, both in accuracy and in how uncertain they were about what a sketch meant (watch from 33:37).
The lab then compared people with CLIPasso, a sketch-generating model (Vinker et al., 2022; watch from 34:38). With generous budgets, human and machine sketches evoked similar sets of meanings even though they looked different. As the budget tightened, the two diverged sharply: people and the model simplify drawings in different ways (watch from 35:38).
Charts as a superpower
The second, newer part of the talk turns to data visualisation. Real observations never fall on clean lines, and inferring the structure behind scattered points is a basic step in science (watch from 37:41). Like the telescope and the microscope, plots let us see what we cannot see directly: patterns too large, too slow or too noisy for our eyes. Fan's example is one of the first time-series plots, William Playfair's 1786 chart of England's imports and exports. It is not obvious until you learn to read it, and after that it is a kind of superpower (watch from 38:41).
Three lines of work follow. First, a benchmark led by Arnav Verma compared people and vision-language models on six standard tests of graph reasoning (watch from 41:50). The models fell short of adults who had taken high-school maths, a gap that the most popular machine-learning chart benchmark would have hidden. Even the strongest model tested, GPT-4V, which looked close on accuracy, did not make human-like errors (watch from 43:51; 44:51).
Second, a study of choosing plots asked people which chart they would show someone to answer a given question. Their choices were best explained by sensitivity to what each plot made easy to answer, measured on about 1,700 other participants. In other words, non-experts are tuned to the features that make a plot fit a question, which, Fan says, gives an intro-statistics teacher hope (watch from 45:51; 49:56).
Third, a study led by Erik Brockbank asked what existing tests of graph literacy actually measure. People's mistakes were explained better by a small set of underlying factors than by chart type or question type, the categories textbooks use to organise these skills. That is an invitation to build better measures (watch from 52:02; 54:05).
Why it matters
Fan closes on education and design. Cognitive tools are how each generation stands on the shoulders of the last, and how people imagine a better world and then build it (watch from 56:05). In the questions, an audience member points out that a system able to predict how a chart will be misread would be valuable. Fan connects that to how skilled teachers diagnose misconceptions, and to mechanistic interpretability, which Fan describes as cognitive neuroscience for artificial networks, as a way to find where right and wrong answers come from (watch from 60:08; 62:10).
For anyone building AI that reads diagrams and charts, the talk offers a sharper test than accuracy. A system that matches people on average but fails in different ways has not learned the same abstraction. The useful question is the one Fan keeps asking: does the system get things wrong in the way people do, and do its sketches and chart readings change with context the way ours do? Fan and colleagues' review of drawing as a cognitive tool is a good next read (Fan et al., 2023).
References
Fan, J. E., Bainbridge, W. A., Chamberlain, R., & Wammes, J. D. (2023). Drawing as a versatile cognitive tool. Nature Reviews Psychology, 2(9), 556–568. https://doi.org/10.1038/s44159-023-00212-w
Fan, J. E., Hawkins, R. D., Wu, M., & Goodman, N. D. (2020). Pragmatic inference and visual abstraction enable contextual flexibility during visual communication. Computational Brain & Behavior, 3(1), 86–101. https://doi.org/10.1007/s42113-019-00058-7
Huey, H., Lu, X., Walker, C. M., & Fan, J. E. (2023). Visual explanations prioritize functional properties at the expense of visual fidelity. Cognition, 236, Article 105414. https://doi.org/10.1016/j.cognition.2023.105414
MIT Siegel Family Quest for Intelligence. (2025, April 8). Prof. Judy Fan: Cognitive tools for making the invisible visible [Video]. YouTube. https://www.youtube.com/watch?v=AF3XJT9YKpM
Mukherjee, K., Huey, H., Lu, X., Vinker, Y., Aguina-Kang, R., Shamir, A., & Fan, J. E. (2023). SEVA: Leveraging sketches to evaluate alignment between human and machine visual abstraction. In Advances in Neural Information Processing Systems 36 (pp. 67138–67155). https://arxiv.org/abs/2312.03035
Vinker, Y., Pajouheshgar, E., Bo, J. Y., Bachmann, R. C., Bermano, A. H., Cohen-Or, D., Zamir, A., & Shamir, A. (2022). CLIPasso: Semantically-aware object sketching. ACM Transactions on Graphics, 41(4), 1–11. https://doi.org/10.1145/3528223.3530068