
Neuromorphic
Language in the Brain, Millisecond by Millisecond: An Interactive 3D Timeline
An interactive 3D brain: step through an illustrative 600 ms language timeline on the Yale Brain Atlas, or switch to EXEPERT's simulated 7,241-neuron network. What each stage draws on, and what the picture cannot claim.
 Akmal Alif · 9 October 2026 MYT
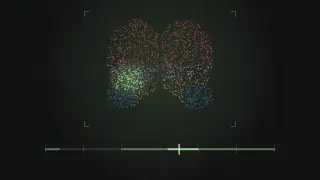
This explorer used to sit on the EXEPERT home page. It now has a page of its own, with room to explain what it shows and what it does not.
It has two views. Human language steps through an illustrative 600-millisecond timeline of language processing on the Yale Brain Atlas, a 3D map of the human cortex. EXEPERT system shows the simulated network behind EXEPERT's own brain visualisations: 7,241 neurons joined by 19,693 axons.
How to use it
Pick a stage on the rail under the timeline, or press play to step through all six. The time readout and the highlighted parcels follow along.
Front, Left, Right and Top turn the model to a fixed view, and Reset brings it back. With a mouse you can also drag the brain to rotate it. On a touch screen, switch Rotate on first so the page still scrolls.
About & 3 sources opens the full note on how the timeline was put together, with links to the three studies behind it.
The timeline, stage by stage
The stages come from three separate studies. Each measured something different, with its own stimuli and its own zero point, so the timeline is a curated sequence rather than a single recording.
0 ms — sound onset. The illustrative sequence begins when sound reaches the listener.
12–37 ms — early auditory cortical response. Temporal parcels illustrate an early-response window. Liégeois-Chauvel and colleagues (1994) recorded directly from the human auditory cortex and described its early middle-latency responses. The 12–37 ms window is an interface illustration near those components, not an interval stated in the paper.
~200 ms — lexical processing. Inferior-frontal parcels illustrate the lexical stage that Sahin and colleagues (2009) measured with electrodes inside Broca's area.
~320 ms — grammatical processing. The same recordings showed a later component linked to grammatical processing, illustrated on the same inferior-frontal parcels.
~400 ms — semantic integration/N400. Kutas and Hillyard (1980) found that a word that does not fit its sentence evokes a negative brain potential peaking around 400 ms, now known as the N400. They recorded it from the scalp while people read sentences one word at a time, so the explorer marks the timing without lighting up any atlas parcel.
~450–600 ms — phonological and response preparation. Inferior-frontal and motor parcels give a curated picture of phonological and response preparation, drawing on the latest of the three components in Sahin and colleagues' recordings. It is not a measured fixed route.
The Yale Brain Atlas view
The human model comes from the Yale Brain Atlas, which divides the cortex into 696 parcels about a centimetre across so that recordings from different patients can be placed on one shared map (McGrath et al., 2022). The explorer loads a pinned, self-hosted copy of the atlas's MIT-licensed 3D model from the Yale Brain Atlas repository.
At each stage a curated group of parcels lights up. Those highlights are visual aids chosen for this timeline. They are not source localisations, and they do not claim that every cited effect was measured in those parcels.
The EXEPERT system view
Switch to EXEPERT system to see a different kind of brain: the network behind EXEPERT's own visualisations. Its 7,241 neurons and 19,693 axons are derived reproducibly from EXEPERT's reviewed point cloud, so the same graph appears every time.
The four channels (visual, auditory, language and attention) are simulation controls, not anatomical brain regions. The moving points are seeded illustrations of activity over the selected channel. They are not live telemetry from a model or a person.
Limits
This illustrative timeline combines separate studies with different stimuli and time origins. Atlas highlights are curatorial, not source localisations. It is not a literal recording, not a diagnostic model, and not a single fixed neural pathway.
References
Kutas, M., & Hillyard, S. A. (1980). Reading senseless sentences: Brain potentials reflect semantic incongruity. Science, 207(4427), 203–205. https://doi.org/10.1126/science.7350657
Liégeois-Chauvel, C., Musolino, A., Badier, J. M., Marquis, P., & Chauvel, P. (1994). Evoked potentials recorded from the auditory cortex in man: Evaluation and topography of the middle latency components. Electroencephalography and Clinical Neurophysiology/Evoked Potentials Section, 92(3), 204–214. https://doi.org/10.1016/0168-5597(94)90064-7
McGrath, H., Zaveri, H. P., Collins, E., Jafar, T., Chishti, O., Obaid, S., Ksendzovsky, A., Wu, K., Papademetris, X., & Spencer, D. D. (2022). High-resolution cortical parcellation based on conserved brain landmarks for localization of multimodal data to the nearest centimeter. Scientific Reports, 12, Article 18778. https://doi.org/10.1038/s41598-022-21543-3
Sahin, N. T., Pinker, S., Cash, S. S., Schomer, D., & Halgren, E. (2009). Sequential processing of lexical, grammatical, and phonological information within Broca's area. Science, 326(5951), 445–449. https://doi.org/10.1126/science.1174481